New analytics is an interactive tool that helps you track performance and activity within your course. It is available to use in every published Canvas course and data is refreshed every 24 hours.
Watch the video, download the guide or follow onscreen instructions below to find out how to access and use New Analytics.
View/Download – New Analytics guide
New Analytics – overview and links
How to access New Analytics and Help menu
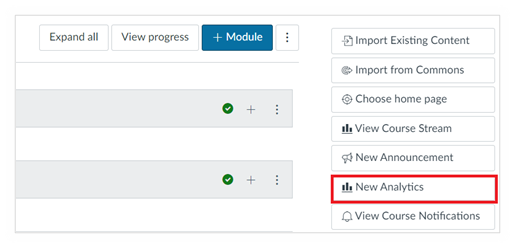
To access New Analytics, go to your Canvas course homepage and select it from the menu on the right side of the page:
Help Menu
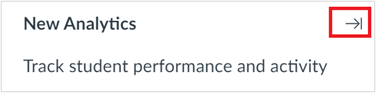
When you first open New Analytics it displays a help menu with links to support guides. To access a guide, click the relevant link and to hide the menu, click the right arrow icon:
There are four sections/tabs within New Analytics: Course grade, Weekly Online Activity, Students and Reports. Find out about each in the sections below.
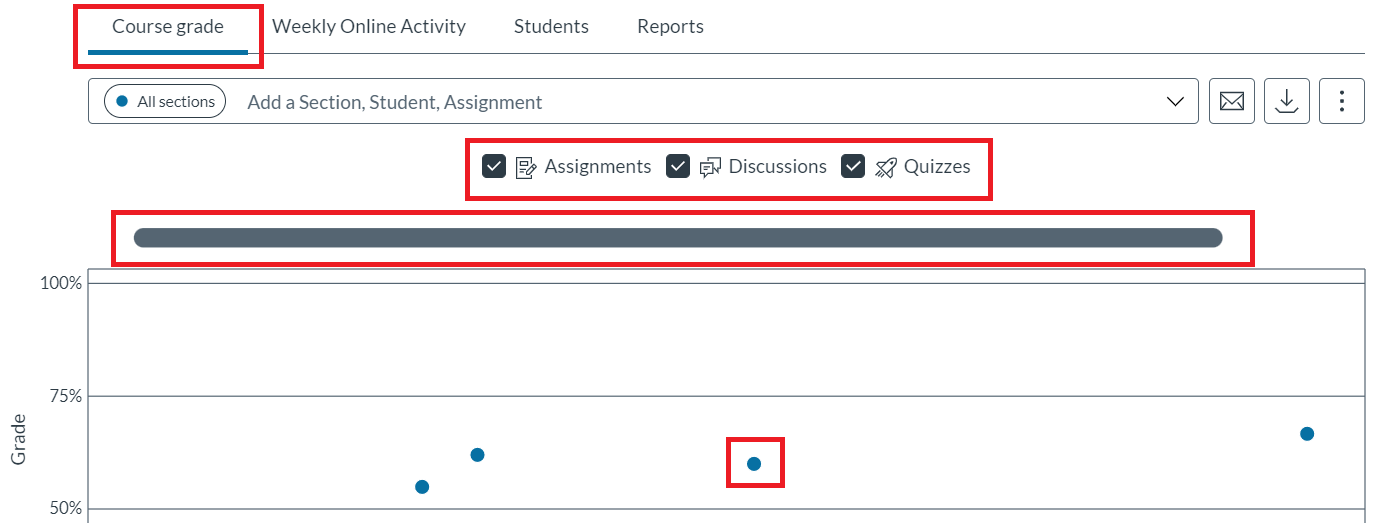
Course Grade

Course grade is the default view when you first launch New Analytics. The average course grade is displayed at the top of the page together with the date/time that data was last refreshed.
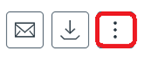
On the right side of the page, you will see three icons that allow you to email students, download a CSV file or click the 3-dot icon for options to view the chart as shapes (default view) or as a data table (list view):
Beneath this is a chart that displays data points for each assessment activity represented by dots. Blue dots represent graded activities and clear dots represent ungraded activities.
The default view displays dots in the chart for every Canvas assessment activity within the course, but you can uncheck check boxes to view data for individual activities – e.g., assignments
Note: If there are too many activities to view, a bar will display immediately above the chart that allows you to scroll along the timeline
Grade details
- Hover over a dot to reveal the activity title
- Click the dot to access more details:
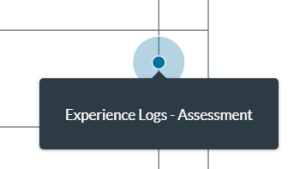
- This will display details of average, low and high grade and the number of missing and late
- Click the number under missing (and/or late if appropriate) to view student names

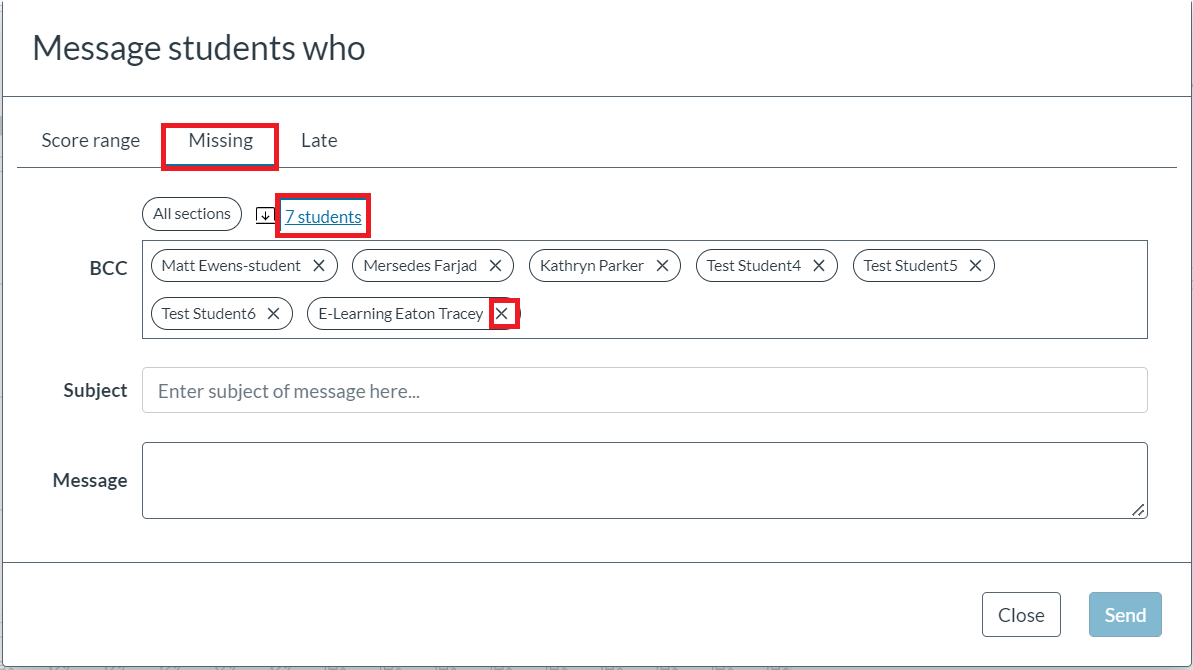
- To email students with late or missing work, click the envelope icon (message students who)
- Click the Missing tab and the number displayed (7 in this example) to add them to the recipient box
- To remove a student, click the X next to their name
- Enter a subject title and reminder message, then click Send
Note: Student names are entered in BCC so they will not see the names of others that have received the email
Weekly Online Activity
![]()
The average course grade is displayed at the top of this page together with the date/time that data was last refreshed.
On the right side of the page, you will see three icons that allow you to email students, download a CSV file or click the 3-dot icon for options to view the chart as shapes (default view) or as a data table (list view)
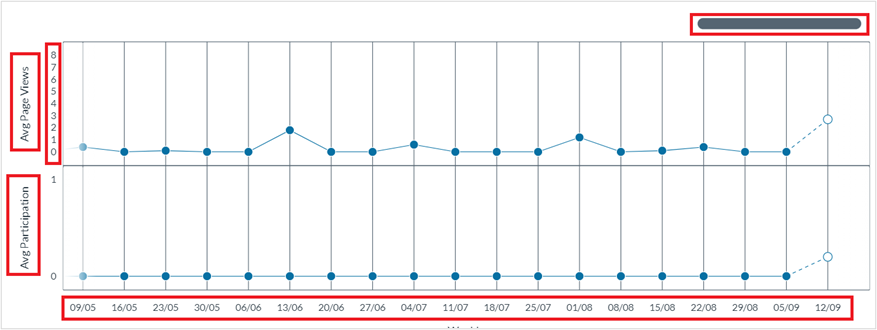
Beneath this there are two charts: average page views and average participation. In both charts, the X axis displays week beginning dates, and the Y axis displays the number of page views/participations. Data points for each are represented by dots. Blue dots indicate that page views/participations have taken place and empty dots indicate zero page views/participations. If there are too many pages/participations to view, a bar will display immediately above the chart that allows you to scroll along the timeline.
Page views & participation details
- Hover over a page view or participation data point to see average and total views/participations
- Scroll beneath the charts to see a list of resources, the number of students that have engaged with them and the number of page views and participations of each
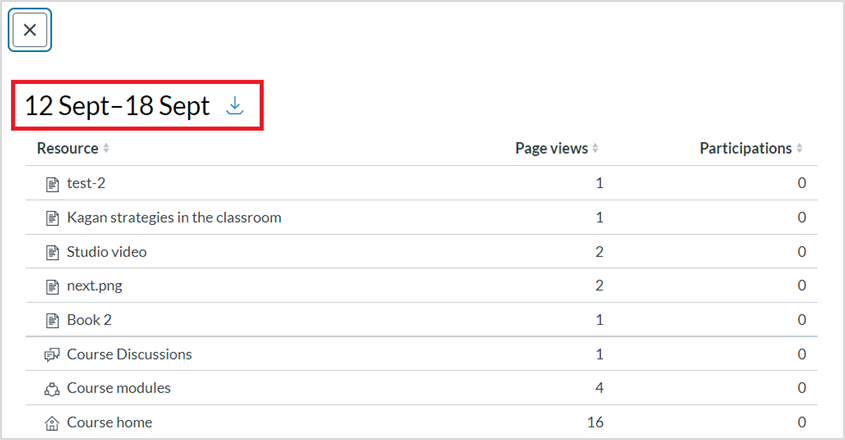
- Click a data point in either chart to see the date range, an option to download a CSV file, total page views and the number of students that did/didn’t view or participate:
- Click on the number that viewed/didn’t view or participated/didn’t participate to see list of student names. This also provides the option to send a message to students.
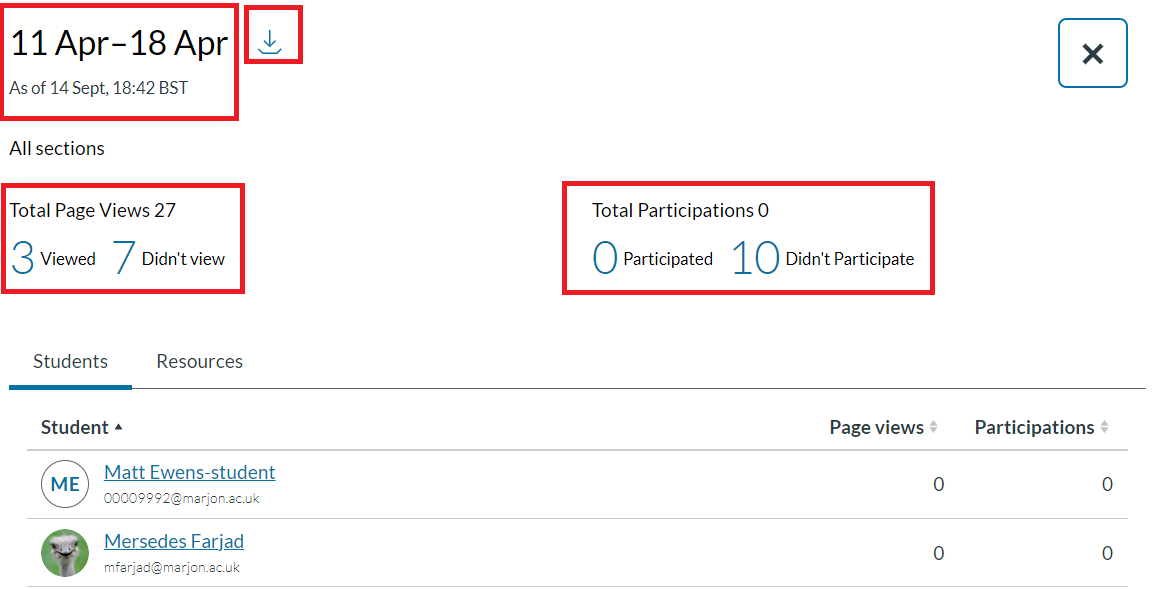
Scroll down to see a list of student names and the number of times they have viewed pages and participated with activities
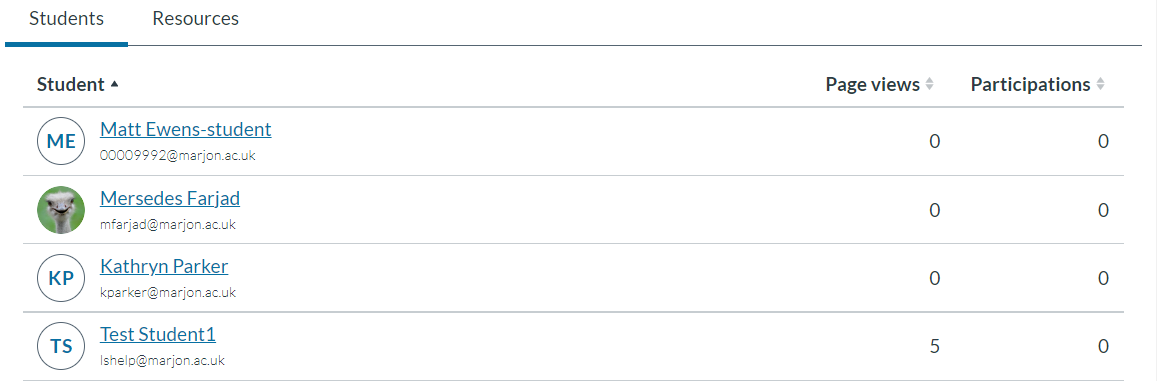
Note: You can click a student’s name to open more detailed information about their grades and weekly activity (This can also be accessed directly by clicking the ‘Student’ tab in New Analytics)
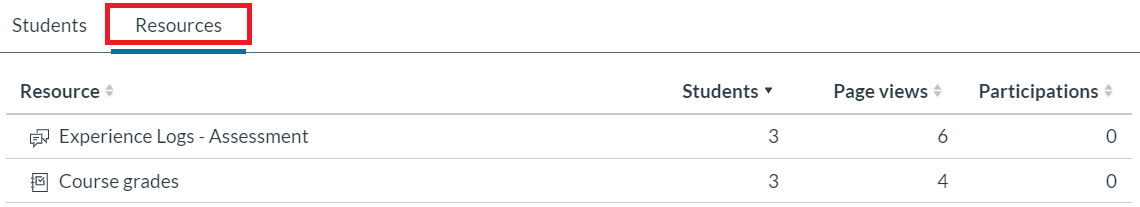
- Click the Resources tab to see a list of resources available in the course during the week selected, the number of students that have engaged and the number of page views and participations
Students
![]()
Students – Course Grade
The average course grade is displayed at the top of this page together with the date/time that data was last refreshed and the date range of the data
- On the right side of the page, you will see two icons that allow you to email students and download a CSV file

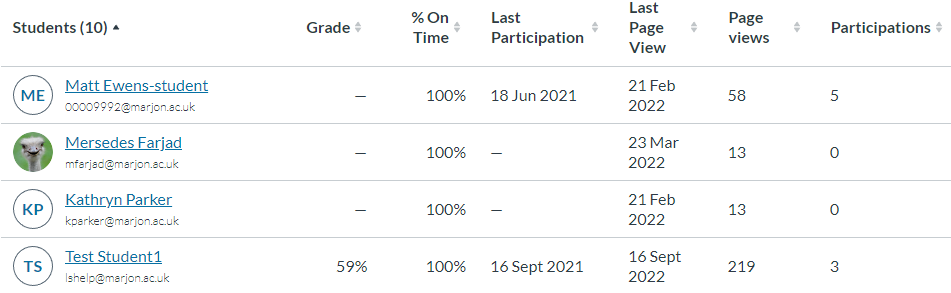
- Beneath this is a list of student names, their overall grade, percent of assignments submitted on or before due date, last participation, last page view and total page views and participations
- To access information for a specific student, click their name
- This will open the Course grade tab and display the student’s overall grade with a chart beneath that displays data points for each assessment
- Hover over a data point to see the assessment title and click a data point to see the student’s grade and whether submitted
on time
Students – Weekly Online Activity
Weekly Online Activity is the tab next to Course Grade and displays the student’s total page views and participations from the beginning of the course up to the current date
- Next to the current date, you will see two icons that allow you to download a CSV file or click the 3-dot icon for options to view the chart as shapes (default view) or as a data table (list view)
- Beneath this there are two charts: Page Views and Participation. In both charts, the X axis displays week beginning dates, and the Y axis displays the number of page views/participations. Data points for each are represented by dots. Blue dots represent page views/participations and empty dots indicate zero page views/participations. If there are too many activities to view, a bar will display immediately above the chart that allows you to scroll along the timeline.
- Hover over a Page View or Participation data point to see the student’s total views/participations

- Click a data point to see a breakdown of page and resource titles and the number of times the student has viewed/participated with them within the timescale shown. In the example below the data point for 12th September has
been clicked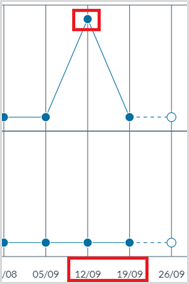
- Detailed information about the student’s Page Views and Participations within the date range are then displayed:
Reports
- The Reports section allows you to run reports on the following:
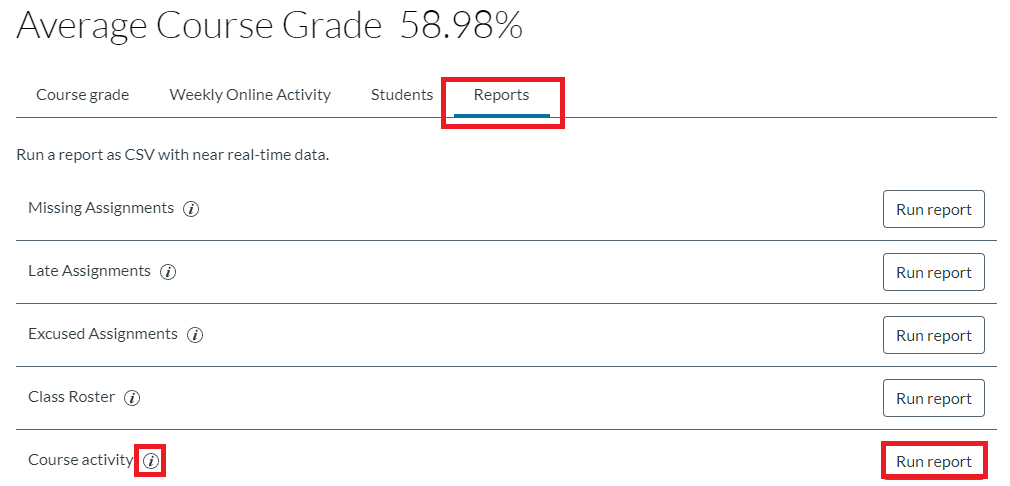
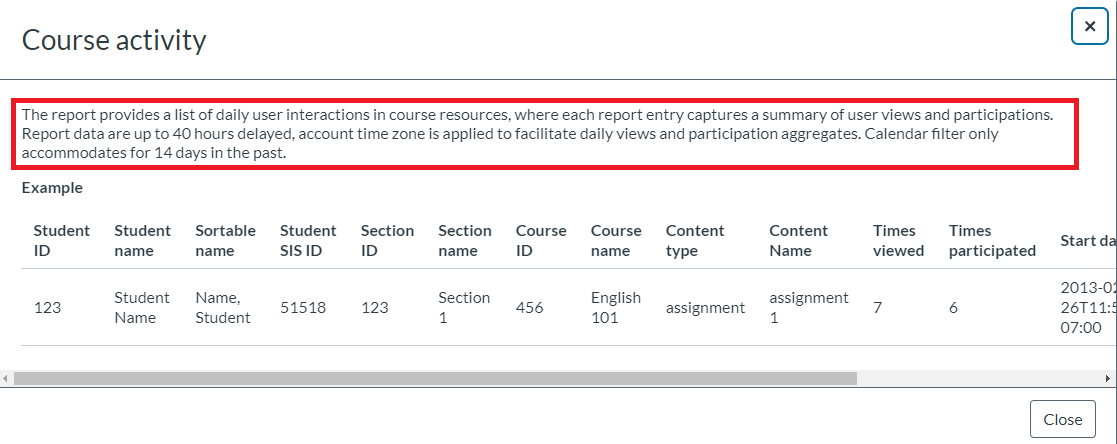
- To see the details of what a specific report will include, click the information icon next to it. In the example below, the Course activity information icon has been clicked:
- To open and configure a report, click the Run Report button
- To add a filter to the report, click the +Filter button, then click the filter by drop down menu and select from the options available – e.g. Student and/or Date

- Click Run report to download the CSV file
